
MHT CET
Current Electricity PYQMHT CET 2026 13th April Morning Shift
MCQ+1 / -02026
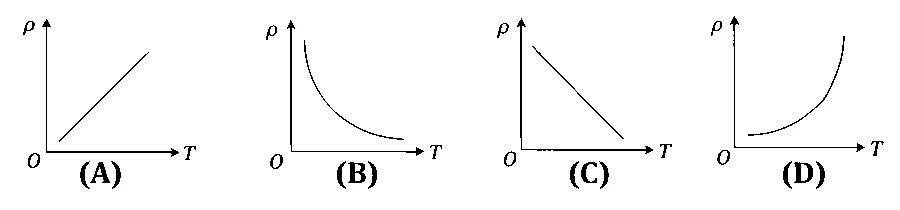
Which of the following graph represents the temperature (T) dependence of resistivity (
Solution
Correct option: B
Answer: B
Use the semiconductor relation
For a semiconductor, resistivity varies with temperature as
Check the effect of increasing temperature
As
Connect carriers with resistivity
The number of free charge carriers increases, so conductivity increases and resistivity
Identify the graph
The decrease is exponential, not linear. Hence the graph showing a rapid non-linear fall of
Correct option: B