
WB JEE
Electrostatics PYQWB JEE 2020
MCQ+1 / -0.252020
As shown in the figure, a point charge q1 = + 1
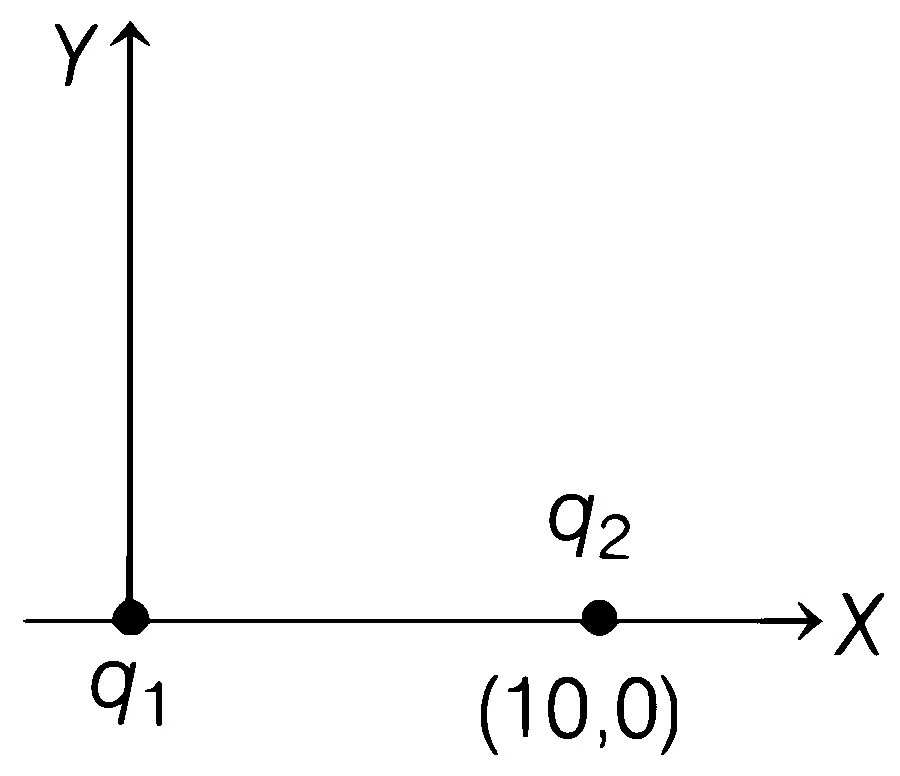
In that case, which of the following graph(s) shows most correctly the electric field vector in Ex in x-direction?
In that case, which of the following graph(s) shows most correctly the electric field vector in Ex in x-direction?
Solution
Correct option: A
The correct variation of
Step 1
The given charges are
Step 2
Thus,
Step 3
For a point charge, the electric field varies as
Step 4
Among the given graphs, option A matches this relative strength and inverse-square variation of