
NEET
Biomolecules PYQAIPMT 2011 Prelims
MCQ+4 / -12011
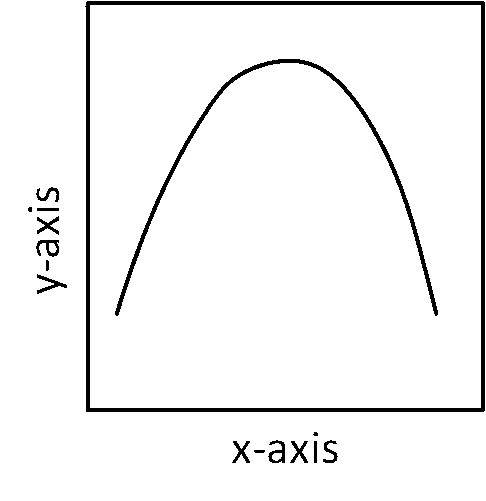
The curve given below shows enzymatic activity in relation to three conditions (pH, temperature and substrate concentration). What do the two axes (x and y) represent?
Solution
Correct option: B
Answer: B. x-axis: temperature; y-axis: enzyme activity
Read the Graph Type
The curve represents how enzyme activity changes under one of the given conditions.
Match the Pattern
The shown relation is between temperature and enzymatic activity.
Assign the Axes
Temperature is plotted on the x-axis, while enzyme activity is plotted on the y-axis.
Conclusion
Therefore, the correct axis labels are x-axis: temperature and y-axis: enzyme activity.