
NEET
Organisms And Populations PYQAIPMT 2009
MCQ+4 / -12009
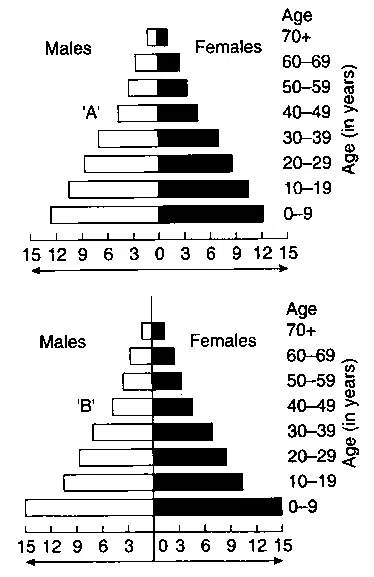
A country with a high rate of population growth
took measures to reduce it. The figure below
shows age-sex pyramids of populations A and B
twenty years apart. Select the correct
interpretation about them : –
took measures to reduce it. The figure below
shows age-sex pyramids of populations A and B
twenty years apart. Select the correct
interpretation about them : –
Solution
Correct option: A
Answer: A. Pyramid A is the more recent one and indicates a slight fall in population growth rate.
Step 1
Compare the two age-sex pyramids as records of the same population at two different times.
Step 2
A country that reduced a high population growth rate would show a narrower younger-age base in the later pyramid.
Step 3
Pyramid A represents this more recent condition, showing only a slight reduction in the growth rate.
Step 4
So, the correct interpretation is that A is more recent and shows slight reduction in growth rate.