
MHT CET
Heat And Thermodynamics PYQMHT CET 2026 18th April Morning Shift
MCQ+1 / -02026
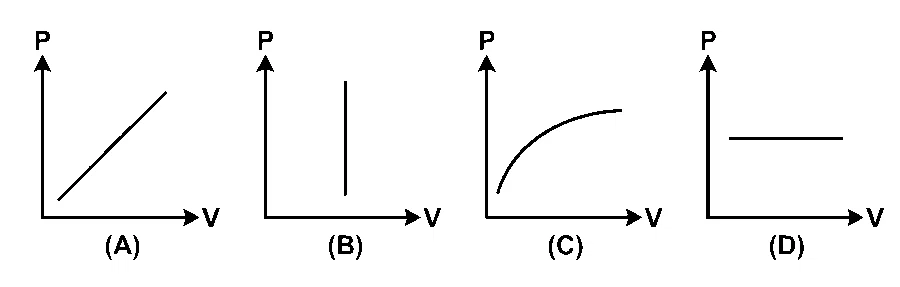
Which of the following graphs between pressure and volume of a gas correctly shows isochoric process in thermodynamics?
Solution
Correct option: D
The correct graph is (B).
Identify the process
In an isochoric process, the gas volume does not change, so
Read the axes
On a
Fix the volume
If volume remains constant, the graph must have the same horizontal-coordinate value throughout.
Choose the graph
A line with constant volume is vertical, i.e. parallel to the pressure axis. Among the options, graph (B) is vertical.