
MHT CET
Heat And Thermodynamics PYQMHT CET 2024 9th May Evening Shift
MCQ+1 / -02024
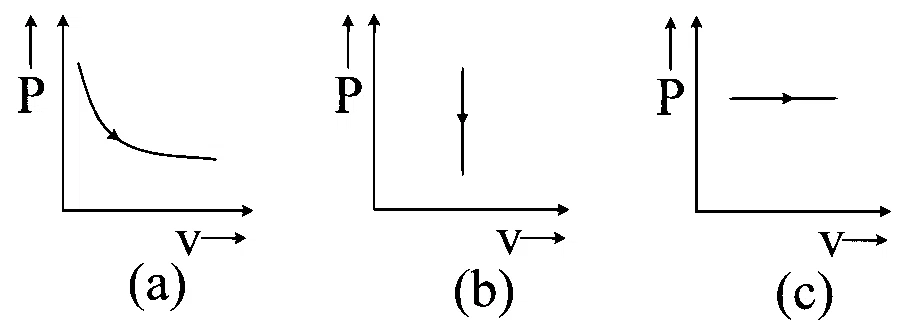
The P-V diagrams for particular gas of different thermodynamic processes are given by
Solution
Correct option: D
Figure (a) is isothermal and figure (c) is isobaric. Hence, option D is correct.
Start with gas equation
For the gas, use the ideal gas equation:
Identify isothermal curve
In an isothermal process, temperature remains constant, so
Use constant-pressure condition
An isobaric process corresponds to constant pressure on the
Match the figures
Figure (c) represents the isobaric curve, while figure (a) represents the isothermal curve.
Choose the option
Therefore, figure (a) and figure (c) show isothermal and isobaric curves respectively. Hence, the correct answer is D.