
MHT CET
Heat And Thermodynamics PYQMHT CET 2023 10th May Evening Shift
MCQ+1 / -02023
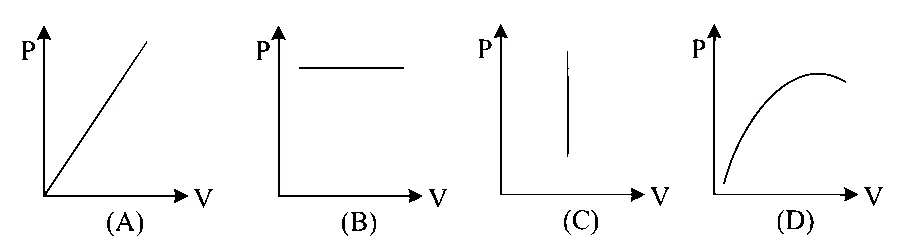
Which of the following graphs between pressure (P) and volume (V) correctly shows isochoric changes?
Solution
Correct option: C
Answer: C
Identify the Process
In an isochoric process, the volume remains constant.
Use the P-V Graph Meaning
On a
Recognize the Shape
A graph with fixed
Choose the Matching Graph
Among the given graphs, graph C is vertical. Hence it represents an isochoric change.