
JEE Main
Heat And Thermodynamics PYQJEE Main 2023 (Online) 1st February Evening Shift
MCQ+4 / -12023
For three low density gases A, B, C pressure versus temperature graphs are plotted while keeping them at constant volume, as shown in the figure.
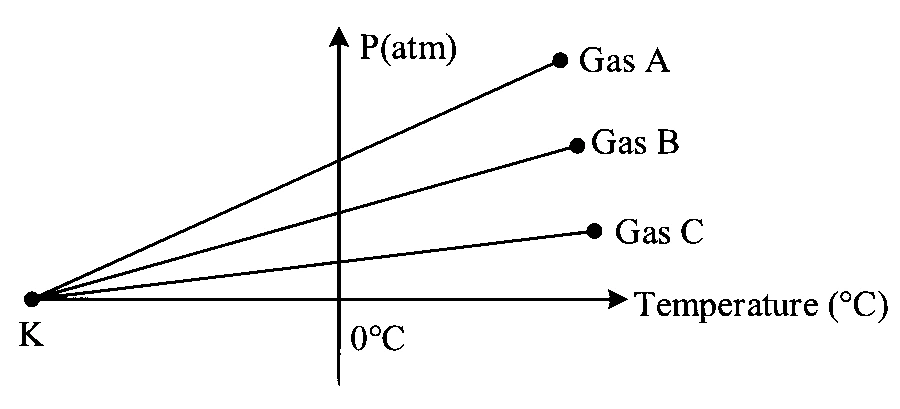
The temperature corresponding to the point '
Solution
Correct option: A
The temperature at point
Use constant-volume relation
For a low-density gas at constant volume, the ideal gas law gives
Interpret the graph
So each pressure-temperature graph is a straight line, and the lines meet the temperature axis at the same limiting point.
Check the axis intercept
At the temperature-axis intercept, pressure becomes zero:
Convert absolute zero
This corresponds to