Jee Main
Center Of Mass
JEE Main 2023 (Online) 30th January Morning Shift
MCQ+4 / -12023
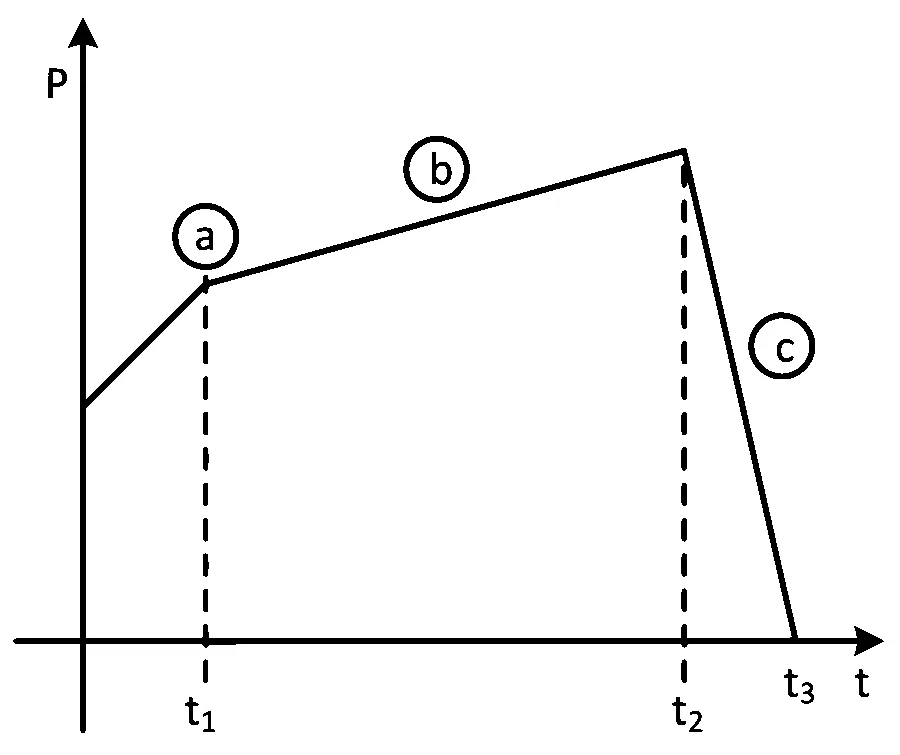
The figure represents the momentum time (\(\mathrm{p}-\mathrm{t}\)) curve for a particle moving along an axis under the influence of the force. Identify the regions on the graph where the magnitude of the force is maximum and minimum respectively?
If \(\left(t_{3}-t_{2}\right) < t_{1}\)