
JEE Main
Gaseous State PYQJEE Main 2020 (Online) 2nd September Morning Slot
MCQ+4 / -12020
Which one of the following graphs is not
correct for ideal gas?
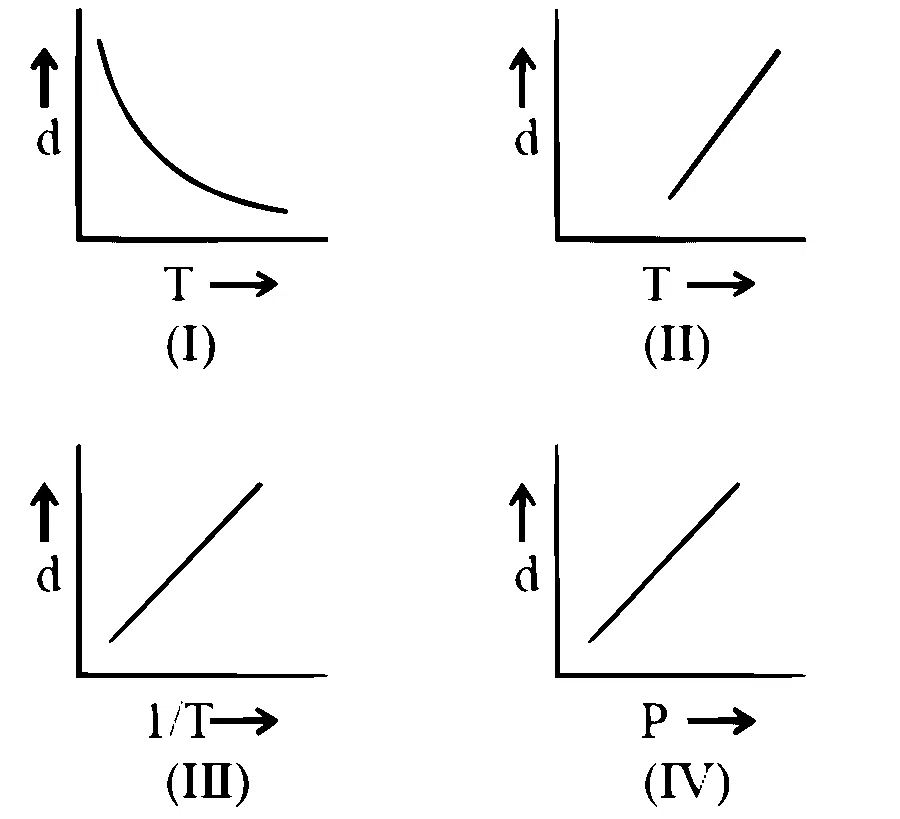
d = Density, P = Pressure, T = Temperature
correct for ideal gas?
d = Density, P = Pressure, T = Temperature
Solution
Correct option: A
Option A is correct. Graph II is not correct for an ideal gas.
Start with ideal gas relation
For an ideal gas, use
Relate density with pressure and temperature
Rearrange the expression:
Check density versus temperature
At constant pressure,
Check the other direct relations
The graph of
Identify the incorrect graph
Thus graph II does not match the ideal gas relation.