
JEE Main
Heat And Thermodynamics PYQJEE Main 2017 (Online) 9th April Morning Slot
MCQ+4 / -12017
For the P-V diagram given for an ideal gas,
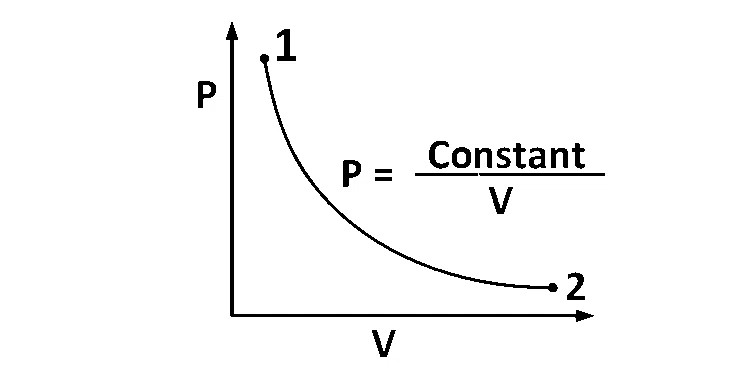
out of the following which one correctly represents the T-P diagram ?
out of the following which one correctly represents the T-P diagram ?
Solution
Correct option: C
Correct answer: C
Use ideal gas equation
For an ideal gas,
Since
Identify the process
The given P-V curve has
So,
Compare pressures
From the P-V graph, pressure at point 1 is greater than pressure at point 2.
Choose T-P graph
Since temperature remains constant while pressure changes from higher to lower, the correct T-P representation is option C.