
JEE Advanced
Heat And Thermodynamics PYQJEE Advanced 2013 Paper 2 Offline
MCQM+4 / -22013
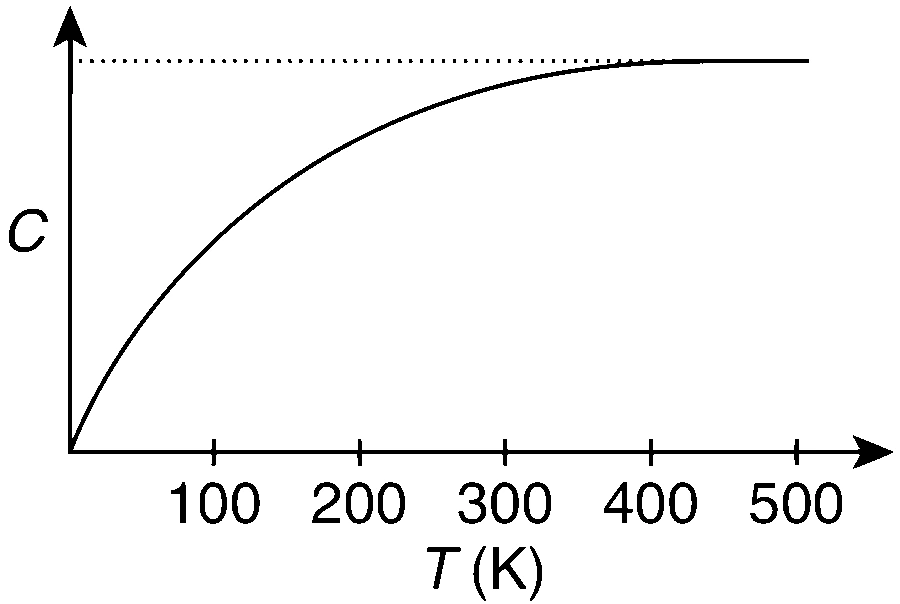
The figure below shows the variation of specific heat capacity (C) of a solid as a function of temperature (T). The temperature is increased continuously from 0 to 500 K at a constant rate. Ignoring any volume change, the following statement(s) is(are) correct to a reasonable approximation.
Solution
Correct option: A, B, C, D
Correct options: A, B, C and D
Relate Heat Rate To Specific Heat
From specific heat capacity,
Range 0-100 K
In the range
Compare Heat Absorbed
Heat absorbed is
Range 400-500 K
Between
Range 200-300 K
Between