
AP EAPCET
States Of Matter PYQAP EAPCET 2021 - 19th August Morning Shift
MCQ+1 / -02021
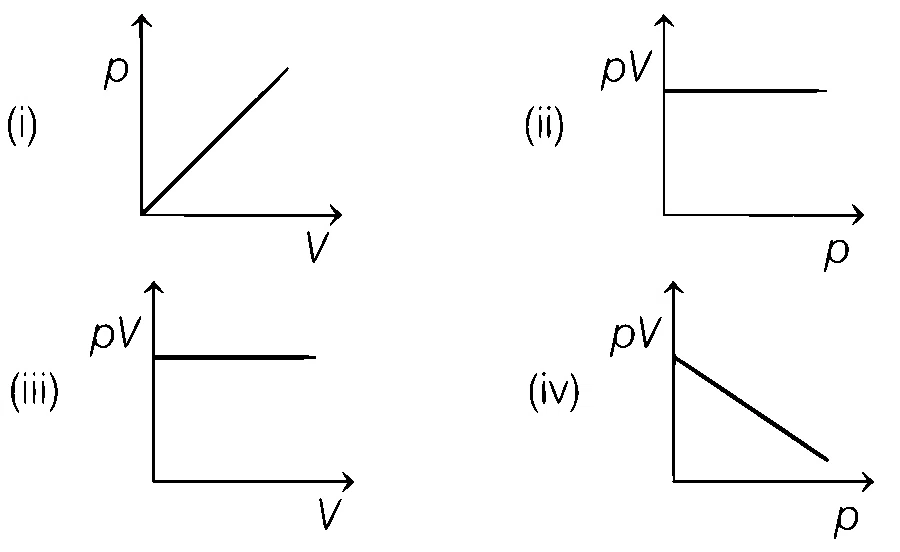
Which of the following graphs correctly
represents Boyle’s Law?
Solution
Correct option: B
Correct option: B
Use Boyle’s law
For a fixed amount of ideal gas at constant temperature, pressure varies inversely with volume:
Convert to equation form
From the ideal gas equation,
Since
Identify the valid graph types
The relation
Also,
Match with the options
Thus, the correct graphs are (ii) and (iii).
So, the answer is B.